 |
| Schedule Analyzer | Overview | Dashboard |
|
| Schedule Analyzer | Overview | Dashboard |
Expand a section to locate the problem areas. 'Drill-down' by clicking on any underlined entry and go directly to that report. Double-click on any line in the report and go directly to the activity in question in your Primavera schedule! Once you have satisfied yourself with an in-depth analysis, return to your report and jump directly to that activity. Quickly review everything, a feat you never thought possible!
The picture below is a screen shot of all three parts of SA Dashboard running together. The Dashboard is shown in the upper-right hand portion of the screen. The report, "Unusual Number of Mobilization Activities" is shown in the lower-right. We double-clicked on the activity line discussing Activity MOB-1020 and the curser jumped directly to this activity in the P3 schedules (as shown on the left.)
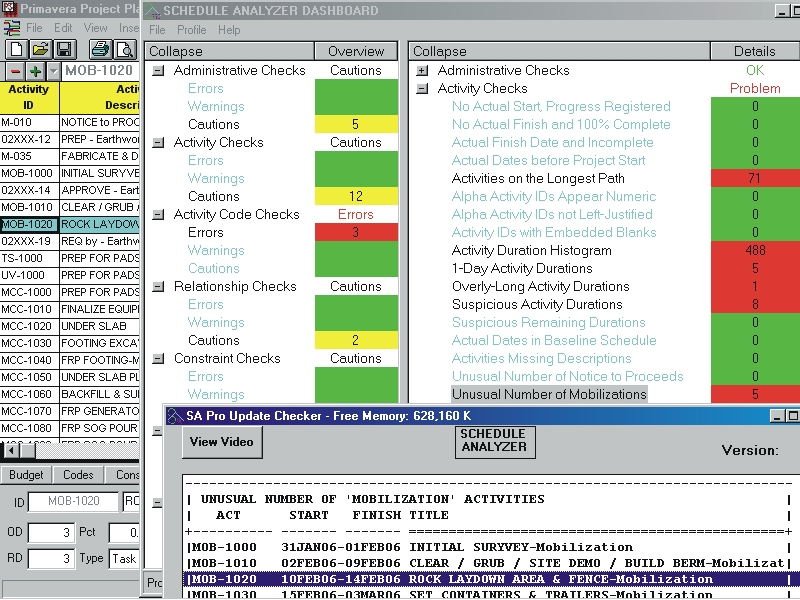
Note: Ordinarily, more of each window would show but we reduced our screen size to SVGA in order to make the contents more clear.